Monte Carlo Simulation in Excel simplified!
Monte Carlo Method
It is a mathematical way of approximate the probability by generating the random variables. Monte Carlo simulation is the computerized method for applying the Monte Carlo method.
Monte Carlo Simulation simplified
STEP 1. Find the Three point estimate
- Best case , Normal case, Worst case estimate ( Min , Max , Average )
STEP 2. Find the Mean,StDev and Number of Iterations required
- No. of iterations are important for reducing the total error percentage.
STEP 3.Use the Excel rand() function with the low and high points to generate a normal distribution.
- Formula for generating random probability is =rand()* (Max estimate - Min Estimate) + Min Estimate
STEP 4.Propagate the random generation for number of iterations.
- Use the Excel's data table to propagate the random generation. Please check the example file attached.
STEP 5.Use Excel's Countif() function to calculate the number of probability occurrence.
- See the example file attached for reference.
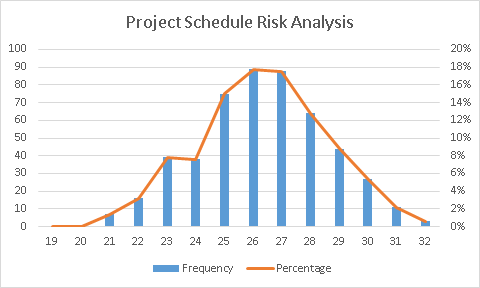
STEP 6.Plot a chart with the data generated with the Step 5 and this will be a bell-shaped curve for normal distribution.
Click her to download my Monte Carlo simulation Excel Examples
Monte Carlo Simulation is used for many purposes including the following :
1.Project Schedule forecasting
2.Project Cost Analysis
3.Investment return estimate
Happy forecasting!

Comments
Post a Comment