Regression Analysis Simplified with Excel
Regression analysis
Regression Analysis a statistical tool for the investigation of relationships between variables. Usually, the investigator seeks to ascertain the causal effect of one variable upon another , the effect of a price increase upon demand, for example, or the effect of changes in the money supply upon the inflation rate.
Regression Analysis with Excel
In this example, Sales Qty is the predictable variable and Price and Advertising are the unpredictable variables. Using Regression Analysis we will find out the relationship between the variables.The big question is: is there a relation between Sales Qty (Output) and Price and Advertising (Input). In other words: can we predict Quantity Sold if we know Price and Advertising?
Click on Data Analysis from the Data Menu from the ribbon as follows :
Click on Regression as follows :
Select the settings as shown below. The Input Y Range is the predicable variable and the Input X is the unpredictable variables data range.
:
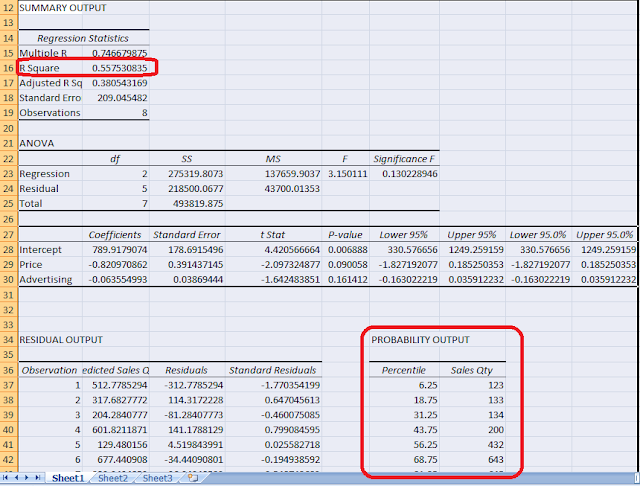
Click OK to generate the analysis. With the above inputs following results generated in Excel. R Square equals 0.557. 56% of the variation in Sales Quantity is explained by the independent variables Price and Advertising.

Click here for the downloadable excel file of above example.
Check out my other post on Montecarlo analysis simplified in Excel


Comments
Post a Comment